
S&P 500 E-Mini Weak High 1 Buy Signal Bar
S&P Emini pre-open market analysis
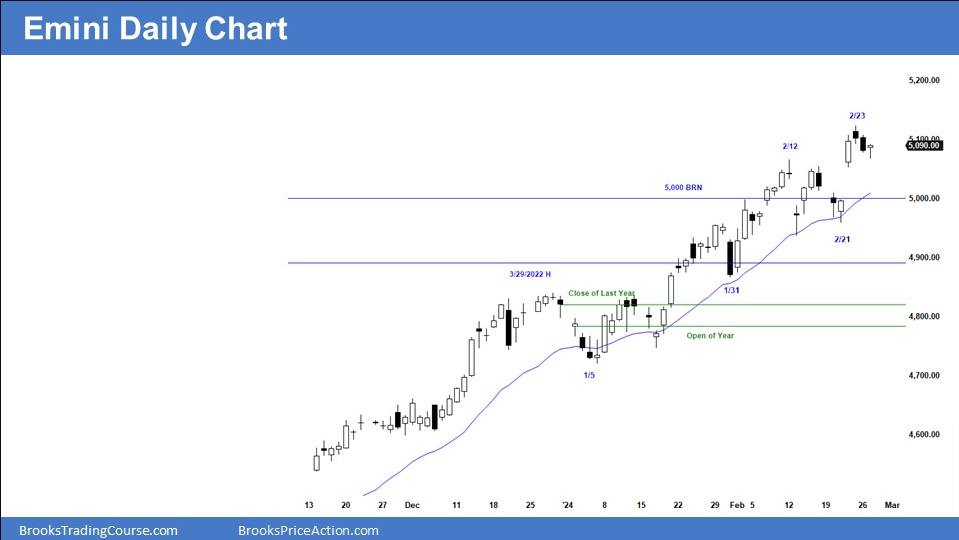
Emini daily chart

o Yesterday, the Emini formed a weak High 1 buy signal bar.
o High 1 buy setups often lead to a pullback, and trend resumption later. The more prolonged the move is, the greater the risk that sellers will be above the High 1 buy setup.
o Because yesterday’s High 1 buy signal is late in a channel, there is an added risk of sellers above and a second leg down.
o Buying above yesterday’s buy signal with a stop below is a low-probability trade. Traders buying above yesterday’s single bar will likely need to scale in lower, possibly at the moving average.
o The bears want to trap the bulls by buying above yesterday’s high and reversing the market down to the moving average.
o There will be bears selling yesterday’s high, trying to trap the bulls into a bad long. This means that there is a risk that the bears get trapped into a losing trade if the bulls can create a strong entry bar today.
o I have often said that the bears need to get strong closes below the moving average to convince traders they are in control. Even if the market gets below the moving average, the odds favor a trading range more than a bear trend.
o The daily chart finds support at the moving average (blue line). This increases the risk that traders will begin to sell above the moving average and only look to buy closer to it.
o Overall, the market will probably test closer to the moving average over the next several days.
Emini 5-minute chart and what to expect today
o Emini is down 15 points in the overnight Globex session.
o The Globex market sold off below yesterday’s low during the early morning hours. It is now going sideways on the 15-minute chart, deciding between a bear flag and a bull breakout of the bear flag.
o The bulls created decent buying pressure at yesterday’s low. This increases the probability of sideways trading on the open.
o Traders should expect a trading range on the open to last for several bars.
o Ideally, traders should consider waiting for 6-12 bars on the open unless the market forms a clear breakout with follow-through, breaking beyond strong support or resistance.
o Yesterday is a High 1 buy signal bar on the daily chart and, therefore, a magnet for the market. Traders should pay attention to yesterday’s high as bulls will try to break far above it, and bears want the opposite. More likely, there are sellers above yesterday’s high, at least for a scalp.
Yesterday’s Emini setups
Here are reasonable stop entry setups from yesterday. I show each buy entry bar with a green arrow and each sell entry bar with a red arrow. Buyers of both the Brooks Trading Course and Encyclopedia of Chart Patterns have access to a near 4-year library of more detailed explanations of swing trade setups (see Online Course/BTC Daily Setups). Encyclopedia members get current daily charts added to Encyclopedia.
My goal with these charts is to present an Always In perspective. If a trader was trying to be Always In or nearly Always In a position all day, and he was not currently in the market, these entries would be logical times for him to enter. These therefore are swing entries.
It is important to understand that most swing setups do not lead to swing trades. As soon as traders are disappointed, many exit. Those who exit prefer to get out with a small profit (scalp), but often have to exit with a small loss.
If the risk is too big for your account, you should wait for trades with less risk or trade an alternative market like the Micro Emini.
[
#EMini #Weak #High #Buy #Signal #Bar