
8 Weekly Charts Giving Clues on What Comes Next for Key Market Sectors
What is the economic modern family saying after a week of China flying, metals rallying, yields and flattening, bottoming and prices dropping?
Not too much, yet.
Let’s examine the weekly charts.

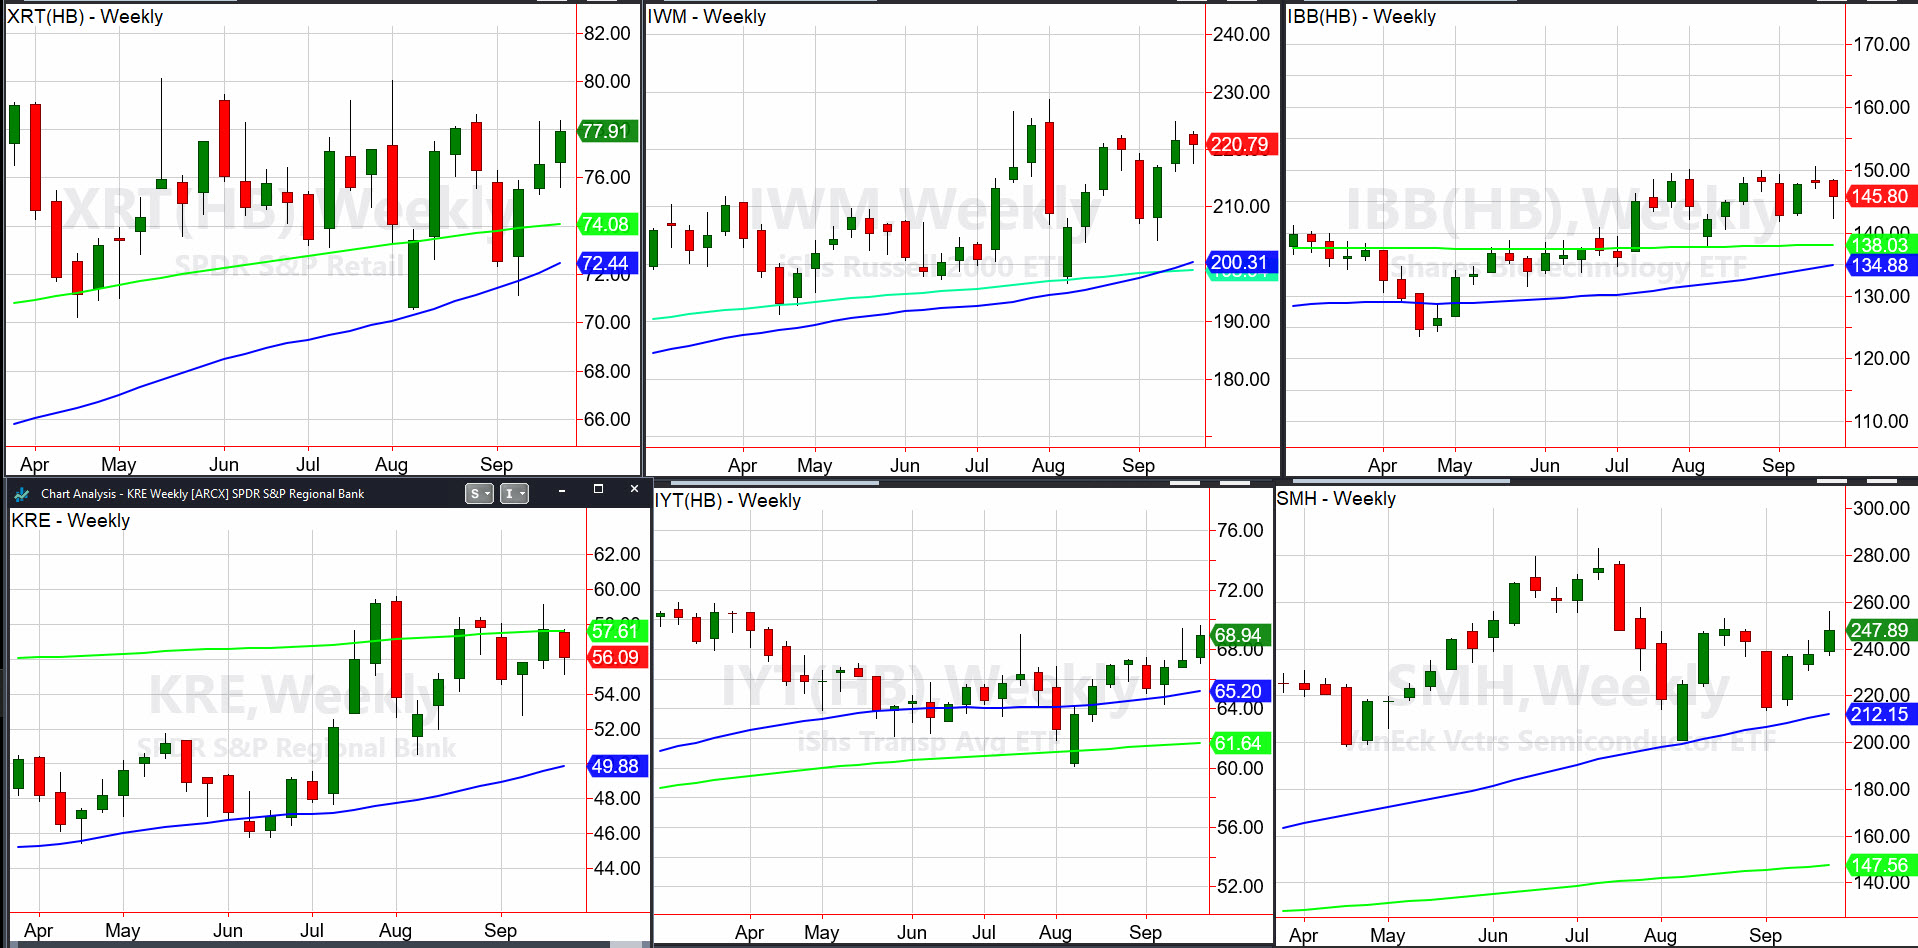
Granny Retail , if you did not see it, the Daily early last week that needs to be watched carefully.
The high-to-low price of this past week was within the high-to-low price of the week prior (inside week).
The green candle though, shows Granny closed higher on the week.
Hence, the channel remains intact and the longer the better when it finally reconciles.
Granddad () also had an inside trading week. Similarly, at some point that trading range will reconcile, and man, will we be ready.
Brother Biotechnology sits proverbially, stuck in the middle, albeit at the top of the 2024 range.
Sister Semiconductors outperformed this past week. But, if you look at the weekly chart, SMH is just in the middle of the range from the lows at 200 and the highs at 280.
Like Granny, Gramps, and her Big Brother, this pause in the action is exciting as when any or all of them move, there will be lots of opportunities.
Before we look at the last 3 members, here is a reminder from another Daily this past week on long bonds:
“A rally in and a potential outperformance of the benchmark could be negative for the dollar and equities, while positive for emerging markets and commodities.”
Looking at the weekly chart of TLT, keep your eyes on the performance versus SPY.
And watch the momentum indicator now looking like a bullish divergence.
Speaking of improving momentum and leadership, behold the weekly chart of .
Not quite there yet, we will watch to see if it continues the drive above 65,000 and how it does compared to .
Transportation, closed higher on the week as well.
With some overhead resistance in its path, we are encouraged that IYT is showing some leadership at this stage.
As we know, Tran can lead the “inside” sectors higher.
Finally, our dear Prodigal Son Regional Banks , never made it back over the 200-WMA (green line).
Yet, just like the rest of the gang, the trading range holds up.
With pretty much everyone still meandering and not showing much direction since July, I remind you again-
Watch the long bonds. They could shake up the Family in all kind of ways!
ETF Summary
(Pivotal means short-term bullish above that level and bearish below)
- S&P 500 (SPY) 565 pivotal support
- Russell 2000 (IWM) Range 215-225
- Dow (DIA) We got to new all-time highs
- Nasdaq (QQQ) 485 pivotal
- Regional banks (KRE) 52-55 support zone
- Semiconductors (SMH) 240 pivotal
- Transportation (IYT) 67.00 support 69 resistance
- Biotechnology (IBB) 140-142 support zone
- Retail (XRT) 77 pivotal
- iShares iBoxx Hi Yd Cor Bond ETF (HYG) Still trading above the 200-WMA-healthy
#Weekly #Charts #Giving #Clues #Key #Market #Sectors