
S&P 500: 5 Key Charts Suggesting Bullish Strength Could Persist Into Year-End
- September defies its weak reputation as the S&P 500 shows remarkable strength.
- A surge in outperforming stocks highlights robust market breadth, the highest since 2002.
- Below, we discuss five key charts that reveal strong momentum for the S&P 500 as 2024 enters its last quarter.
- Looking for actionable trade ideas to navigate the current market volatility? Unlock access to InvestingPro’s AI-selected stock winners for under $9 a month!
September has a reputation for being one of the worst-performing months for the . This year, however, has bucked that trend, with the index now on track to deliver one of the strongest September performances in recent memory.
The number of stocks outperforming the S&P 500 has surged to its highest level since 2002, underscoring the market’s remarkable strength.
With bullish signals emerging across the board, let’s examine five key charts that illustrate how the S&P 500 has defied historical trends this month and could sustain its momentum as we head toward the end of 2024.
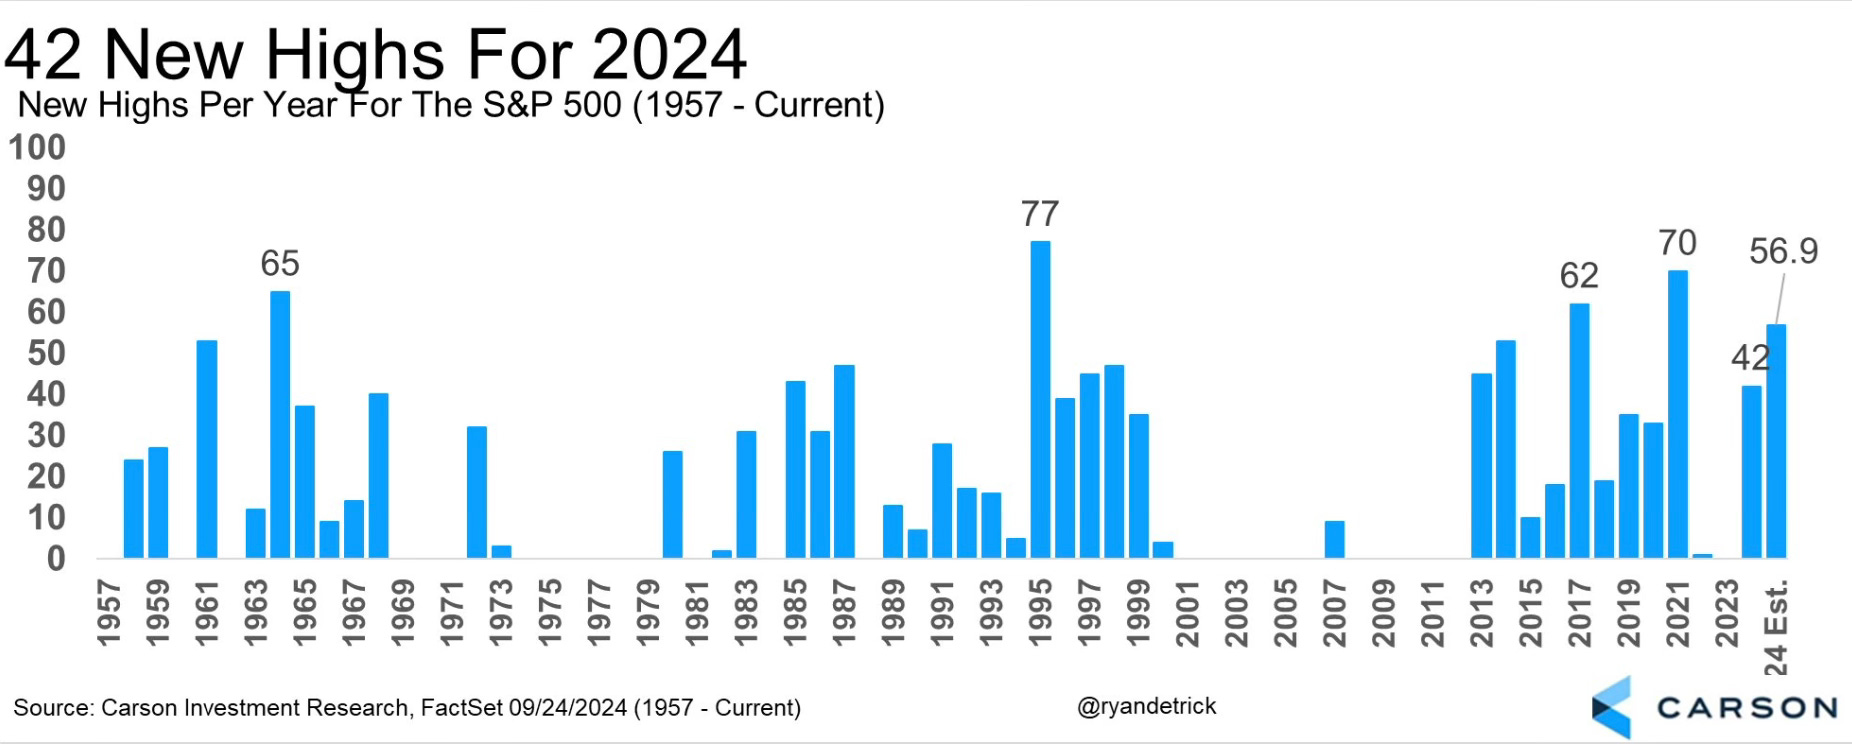
Chart 1: S&P 500 Continues Posting New All-Time Highs
The S&P 500 recently achieved three new all-time highs in a single week, bringing its impressive total for 2024 to 42.

This chart illustrates the frequency of all-time highs for the S&P 500, showcasing its impressive performance this year against the backdrop of September’s historical trends.
Chart 2: Number of Positive Weeks for the Year
Over the past year, the index has shown remarkable resilience, with 35 weeks delivering positive returns—an impressive 67% of the time. This is a clear indication that market momentum is strong.
Chart 3: Number of Stocks Outperforming the Index
This graphic displays the proportion of stocks outperforming the S&P 500, highlighting the highest level since 2002 and signaling strong market breadth.
Chart 4: Disinflation Trends
In this chart, we track the year-on-year disinflation rate shown by the , showing a modest decline from +2.45% to +2.23% while affirming the persistence of the disinflationary trend.
Chart 5: Labor Market Dynamics
This visual representation of the data traces the labor market’s performance since September 2021, illustrating the quick decline followed by nearly three years of sideways movement, dispelling fears of significant deterioration.
Bottom Line
I want to draw your attention to these graphs and data because the current bullish trend is undeniably strong.
This moment presents an opportunity for each of you to reflect critically on the voices you’ve listened to over the past few months.
If you held a bearish view and chose to stay on the sidelines, consider who continues to influence your perspectives on the market today.
If someone has consistently been wrong and keeps pushing the same failed bearish narratives – ask yourself: why should they still have your attention?
***
Disclaimer: This article is written for informational purposes only. It is not intended to encourage the purchase of assets in any way, nor does it constitute a solicitation, offer, recommendation or suggestion to invest. I would like to remind you that all assets are evaluated from multiple perspectives and are highly risky, so any investment decision and the associated risk is at the investor’s own risk. We also do not provide any investment advisory services.
#Key #Charts #Suggesting #Bullish #Strength #Persist #YearEnd