
Bitcoin: Bulls Not Yet Ready to Launch the Breakout Rally
Since the beginning of the year, is up by more than 52%. While prices have been strongly trending higher during the first few months, the Bitcoin rally has stalled out since mid of March. Significant milestones, such as the approval of Bitcoin ETFs and the recent halving event in April 2024, had further fueled optimism and created too much euphoria. Now, more than six months into a sideways torture, the end of the consolidation might be in sight.
Bitcoin Review
In the last five weeks, Bitcoin once again lived up to its volatile reputation, keeping investors on edge with a wide trading range of around USD 13,000. After prices briefly fell to just under USD 50,000 (USD 49,577) in early August due to the “Nikkei Carry Trade Crash,” they recovered to USD 65,103 by the end of the month, driven by bullish stock markets.
From here, however, Bitcoin was pushed down again to USD 52,546 on September 6th within just two weeks. The oversold condition at this low point brought about a significant recovery, so that Bitcoin is currently trading around USD 63,000 and knocking on its flat 200-day moving average (USD 63,935).
Given the overall relatively stable situation in the stock markets and the generous first US interest rate cut in four years (minus 50 basis points), the correction and consolidation phase we correctly predicted is likely now in its final stages. After all, the end of restrictive monetary policy should initially lift almost all asset classes in the coming months. The crypto sector in particular is likely to benefit from this.
Currently, Bitcoin, the leading cryptocurrency, is still about USD 10,750 or 16.5% away from its all-time high of USD 73,793 on March 14th. However, Bitcoin’s dominance has been steadily increasing since the major low in November 2022 and recently reached over 58.5% of the total market capitalization of the crypto sector.
Polygon 2.0
As always, there were plenty of exciting developments in the crypto ecosystem. In particular, the upcoming conversion of Polygon’s token to the new POL token in September 2024 could prove to be an opportunity given its depressed price of USD 0.40. Major crypto exchanges like Binance support the migration, which is part of the “Polygon 2.0” update and aims for unlimited scalability and unified liquidity. Additionally, new Layer-2 projects like Pepe Unchained launched, aiming to improve Ethereum’s scalability and efficiency.
These developments underscore the continuous innovation and evolution in the crypto sector. However, has been an underperformer throughout the entire bull market of the last two years and has lost almost 50% from its spring high at the peak.
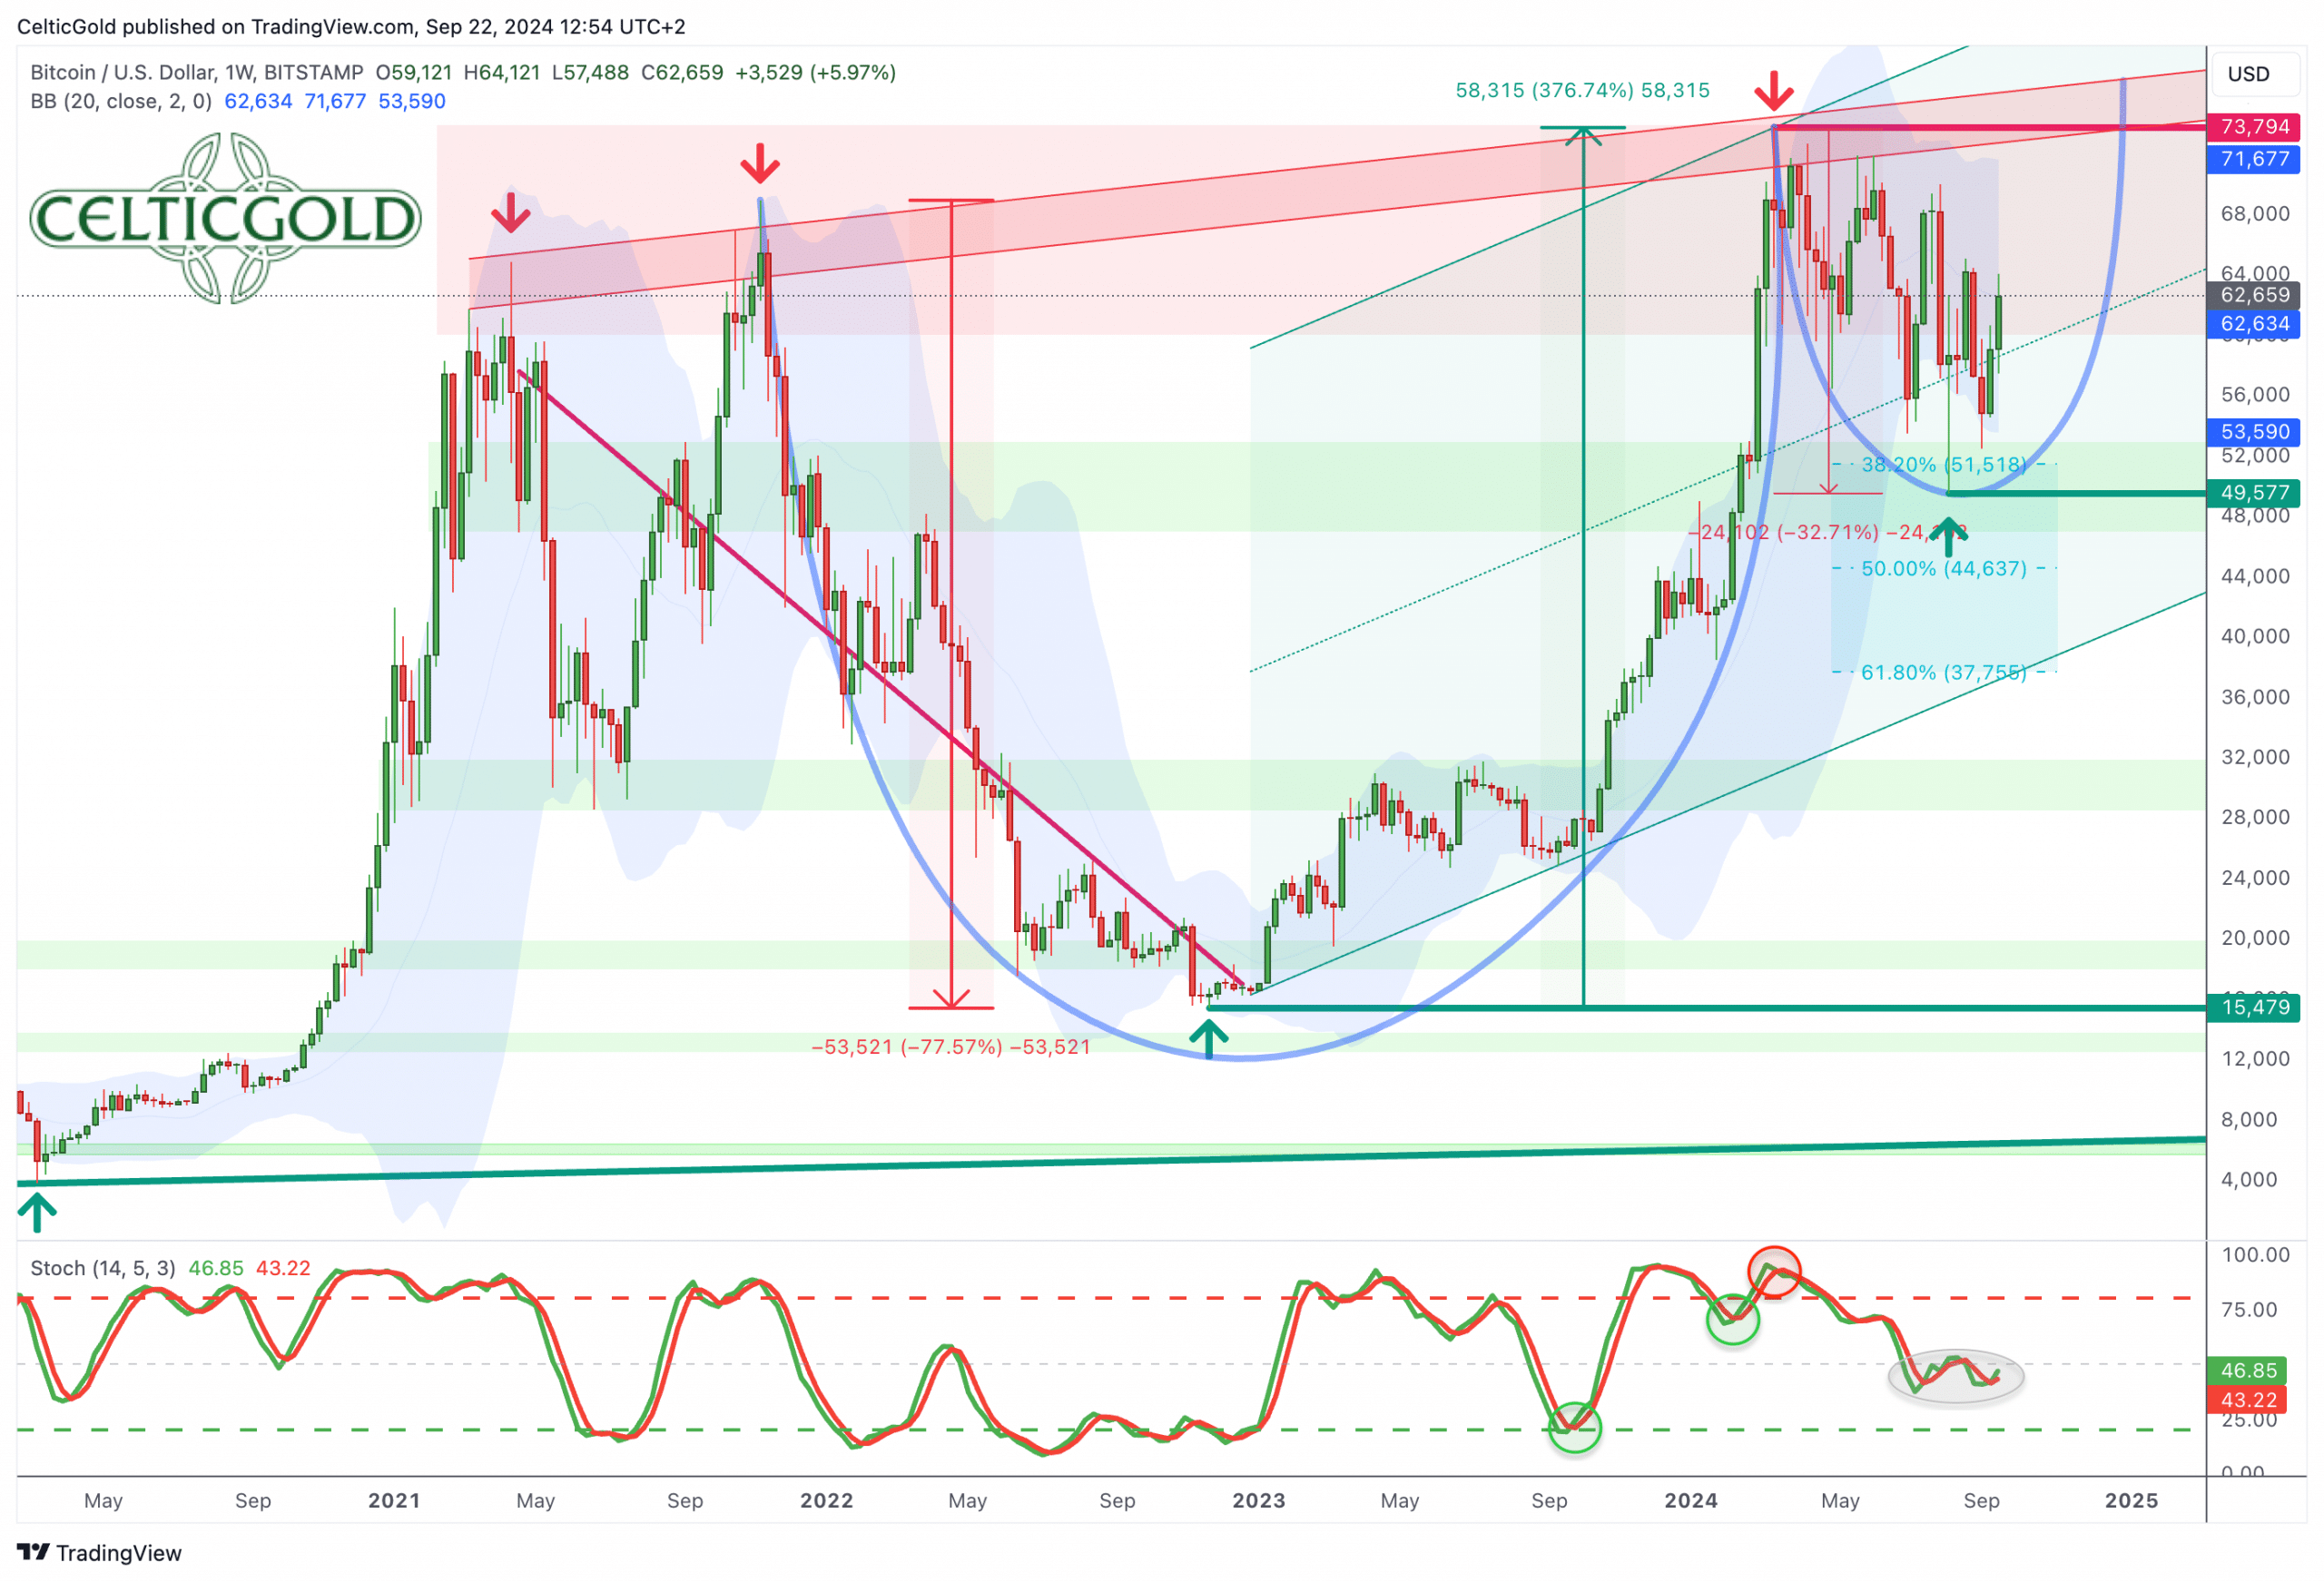
Bitcoin (BTC/USD) Weekly Chart – Handle Approaches its Closing
Source: Tradingview
Since the autumn of 2021 and the all-time high of USD 69,000 at that time, a large cup has formed with the pullback to USD 15,479 and the new all-time high on March 14th at USD 73,794. As suspected, Bitcoin has been working on the corresponding handle as part of the larger “cup-and-handle” since spring. Within this handle, the consolidation/correction should be played out primarily over time and less through deep price pullbacks. This process is now well advanced. Nevertheless, it could still take a few more months until the final completion of the handle.
Obviously, for the successful completion of the cup-and-handle formation, Bitcoin needs a breakout to new all-time highs, i.e., at least above USD 73,794. Since the horizontal resistance zone is somewhat “skewed,” the final upward breakout would probably only be confirmed with prices above approximately USD 77,000. However, any further price increase above USD 70,000 already indicates that Bitcoin prices tend to strive upwards and ultimately aim for new highs.
Bitcoin – Not Yet Ready to Launch the Breakout Rally
On the downside, the August low of USD 49,577 should ideally not be undercut anymore. Otherwise, the technical chart picture would significantly deteriorate. Within the handle, pullbacks to the region of about USD 52,000 to 53,000 would still be possible and should be cautiously factored in.
In sum, the weekly chart remains neutral. At least, the slight downward trend could soon be negated with a rise above the August high of USD 65,103. However, the stochastic oscillator continues to decline and might need more time until a trend reversal. While the heavily overbought condition from spring has been completely eliminated, an ideal oversold situation does not (yet) exist. Overall, the weekly chart gives the impression that the start of the breakout rally could be delayed.
Bitcoin (BTC/USD) Daily Chart – 200-Day Moving Average Is Resistance.
Source: Tradingview
On the daily chart, Bitcoin slipped below its 200-day moving average (USD 63,937) in early August and has not yet been able to sustainably recapture it. This is generally rather bearish.
At the same time, the stochastic oscillator is bullishly embedded in its overbought zone. The uptrend is locked-in and could therefore soon lead to a return above the 200-day moving average line. However, as soon as the bullishly embedded status is lost, the stochastic oscillator will have a lot of room to move downwards to its oversold zone. A direct rise to over 70,000 USD is therefore rather unlikely. A movement to the upper edge of the downward trend channel in the area of about 68,000 USD would probably be the maximum expectation. However, it’s still about 5,000 USD or about 8% away from there.
Overall, the daily chart is currently in a super-bullish embedded uptrend as long as both lines of the stochastic oscillator are above 80. Nevertheless, the air has already become a bit thin in the short term, hence a larger breather in the coming weeks would not be surprising. If the bulls fail at the 200-day moving average line, the situation will deteriorate significantly.
Bitcoin – Balanced Sentiment
Source: Bitcoin Magazine Pro
The “Crypto Fear & Greed Index” is currently in neutral territory at 54 out of 100 points.
Source: Coinmarketcap
The “CMC Crypto Fear & Greed Index” from CoinMarketCap comes to the same conclusion.
After several instances of selling panic in the past two months, sentiment has now calmed down. At the same time, the partially sharp price setbacks have likely brought enough skepticism back into the market. In this respect, we consider the sentiment to be cleared and suspect that the sentiment pendulum can swing towards significantly increased optimism values in the coming months.
Overall, the sentiment depicts a balanced mood and no longer stands in the way of a new rally in the sector.
Bitcoin – Seasonality Turns Bullish in the Second Week of October
Source: Seasonax
Time and again over the past months, we had pointed out that seasonal statistics are not favorable to Bitcoin during the summer months. However, right on cue with today’s start of autumn, the seasonal pattern turns bullish within the coming three weeks. Particularly the second half of October has often been characterized by explosive price increases in the past.
In summary, Bitcoin has reached its seasonal low point and should therefore be able to take off again from mid-October onwards
Sound Money: Bitcoin Vs. Gold
Source: Tradingview
At prices of around USD 63,000 for one Bitcoin and approximately USD 2,620 for a troy ounce of , one currently needs to pay about 24 ounces of gold for one Bitcoin. Conversely, a troy ounce of gold currently costs about 0.0415 Bitcoin.
Against the strong gold price, the consolidating Bitcoin has lost over 38% at its peak in recent months. A trend reversal is not yet visible on the ratio chart. Instead, the 200-day moving average (approximately 27.5) is now turning downwards, while the ratio itself is clearly trading below this closely watched average line.
In summary, the ratio analysis once again confirms the still intact consolidation/correction in Bitcoin. An end is not yet in sight, particularly because the gold price, within its strong upward trend, is likely on its way towards USD 3,000.
Macro Update – Turning Point in US Monetary Policy
Source: Holger Zschäpitz
The (Fed) lowered interest rates for the first time in over four years on September 18th, 2024. The benchmark rate was reduced by 0.5 percentage points to a range of 4.75% to 5.0%. This decision marks a significant shift in the Fed’s monetary policy after a period of continuous rate hikes aimed at curbing inflation. The rate cut comes against the backdrop of easing inflation and a slight cooling of the labor market in the United States.
The implications of this rate cut and the official end of restrictive monetary policy are expected to be far-reaching. For consumers and businesses, this could mean cheaper loans, potentially boosting investment and consumption. Financial markets initially reacted positively to the decision, as lower interest rates make riskier assets like stocks more attractive compared to fixed-income investments. Additionally, the Fed signaled that another rate cut of 0.5 percentage points is possible later this year, supporting expectations for an expansion of loose monetary policy.
However, the rate cut also carries risks. There is a danger that inflation could rise again if the economy is stimulated too much. Furthermore, the may continue to lose value, impacting international trade and global financial markets. The Fed must therefore navigate a delicate balance between promoting economic growth and controlling inflation. The coming months will reveal how this monetary policy decision affects the US economy and global markets.
Markets Expect Another US Rate Cut Of 0.5% By the End of the Year.
Source: Holger Zschäpitz
Already, markets are pricing in significantly larger rate cuts than what the Fed has indicated so far. The Fed’s projections have shifted downward, with markets now expecting the US benchmark interest rate to be at 4.4% by the end of this year, 3.4% by the end of 2025, and 2.9% in 2026.
Source: Pretiorates.com
The “heartbeat” of the US economy also indicates a high risk of recession, despite a recent sharp increase in the “Citi US Economic Surprise Index.” At the same time, three-month US Treasury bills are trading higher than ten-year bonds, which often signals an end to a rate cycle and a trend reversal.
Parallels to 2007
Source: Sven Henrich
The first rate cut by the Federal Reserve in September 2007 marked the beginning of an era of loose monetary policy in response to the impending financial crisis. Similar to today, the Fed attempted to steer economic development through rate cuts at that time. The current situation in September 2024 shows definite parallels as the Fed initiates another rate shift, but this time against a backdrop of an recovering economy and declining inflation.
In both cases—2007 and 2024—the initial rate cut sparked optimism in financial markets. Currently, predicting the long-term effects of this monetary policy is challenging. The rate cuts in 2007 did not prevent the financial crisis; instead, they ultimately pierced that bubble.
From a market psychology perspective, one can conclude in hindsight that the rate cuts in 2007 gradually and unintentionally shifted participants’ perceptions towards questioning “Is it really that bad?”.
Ultimately, mass psychology plays a crucial role in international financial markets and regularly leads to phenomena such as herd behavior, speculative bubbles, or panic selling. Investors and traders are often influenced by collective moods—euphoria or fear—which can lead to irrational market movements. Understanding these psychological dynamics is essential for market analysts and investors to better assess market trends and identify potential exaggerations. Insights from mass psychology help explain and anticipate often irrational behavior.
Blueprint for the Next 12 Months
If one takes events from 2007 as a blueprint for the next twelve months, one might expect the following developments in financial markets:
- Initial Optimism: Following the first rate cut, there could initially be a positive reaction in stock markets until early 2025 as investors hope for economic stimulation. Particularly small- and mid-cap stocks currently appear undervalued compared to real US economic indicators. Therefore, the Index has potential to outperform the .
- Increasing Volatility: By year-end, market volatility could increase significantly as uncertainties about economic development and potential issues within the financial system grow. Additionally, the upcoming US presidential election could contribute to unrest.
- Credit Crisis: Signs of a credit crisis may develop, especially if certain sectors (like real estate back then) come under pressure.
- Flight to Safety: Investors may increasingly shift towards safe-haven assets like government bonds and gold. Bitcoin might not necessarily serve as a safe haven.
- Sectoral Differences: Some sectors may come under more pressure than others, similar to 2007 when the financial sector was particularly affected.
- International Spread: What begins as a local problem could increasingly spill over into international markets.
- Further Monetary Easing: Central banks—especially the Fed—may be forced into more aggressive rate cuts and other measures to stabilize markets over time. Psychologically, market participants will interpret this as an acknowledgment of dramatic circumstances.
Bitcoin 4-Year Cycle
Overall, the first US interest rate cut in four years is likely to initially stimulate financial markets and foster optimism. In essence, almost all asset classes could see significant gains over the next three to four months.
Source: x.com/apsk32
This should also benefit Bitcoin and the entire crypto sector. If the four-year cycle holds true, significant price increases up to at least USD 100,000 or more could be expected by next spring. At the same time, plans should already be made and preparations taken to timely realize profits during foreseeable exaggeration phases since 2025 could become quite uncomfortable.
Conclusion
Although the consolidation or correction in Bitcoin has now been ongoing for over six months, the trend reversal is not yet a done deal. It may take until mid or late October, or even until the US elections, for things to change, possibly requiring further stretching of the timeline. At the same time, from a price perspective, the worst seems to be behind us, and any significant pullback would present a buying opportunity. In the best case, there might be another chance to see prices in the range of 54,000 USD to 55,000 USD. However, we do not expect Bitcoin to fall much lower for now. The chances are increasingly leaning towards the upside.
#Bitcoin #Bulls #Ready #Launch #Breakout #Rally