
Nasdaq 100 Set to Break 20K Barrier – Here’s How to Trade It
Both the and extended their gains, pointing to another record high when the markets re-open after Wednesday’s holiday. European markets were trading mostly higher, while China closed lower.
So, as before, technology is continuing to do the heavy lifting. While the sector continues to trend positively, dip-buying in tech-heavy indices or ETFs like or continues to make more sense than trying to pick the top from a trading point of view, as I will discuss in this article.
That’s not to say I don’t think the market is overstretched. The markets can remain overbought longer than… you know the rest. With sound risk management, the easier trade has clearly been on the long side than short. Let’s continue to concentrate on that direction until the charts tell us otherwise.
Remember, the market has to weaken first before it can reverse. As such, one should not worry about missing “the top” as you will get plenty of opportunities to sell into the rallies at resistance when the market does eventually top out.
Can AI Help Maximize Your Gains?
The answer is yes. Our cutting-edge AI analyzes mountains of data to pinpoint high-potential stocks before the market reacts.
For less than $9 a month, you’ll receive a monthly update featuring our AI’s curated selection of stocks primed for significant upside.
Stop missing out and subscribe to ProPicks today!
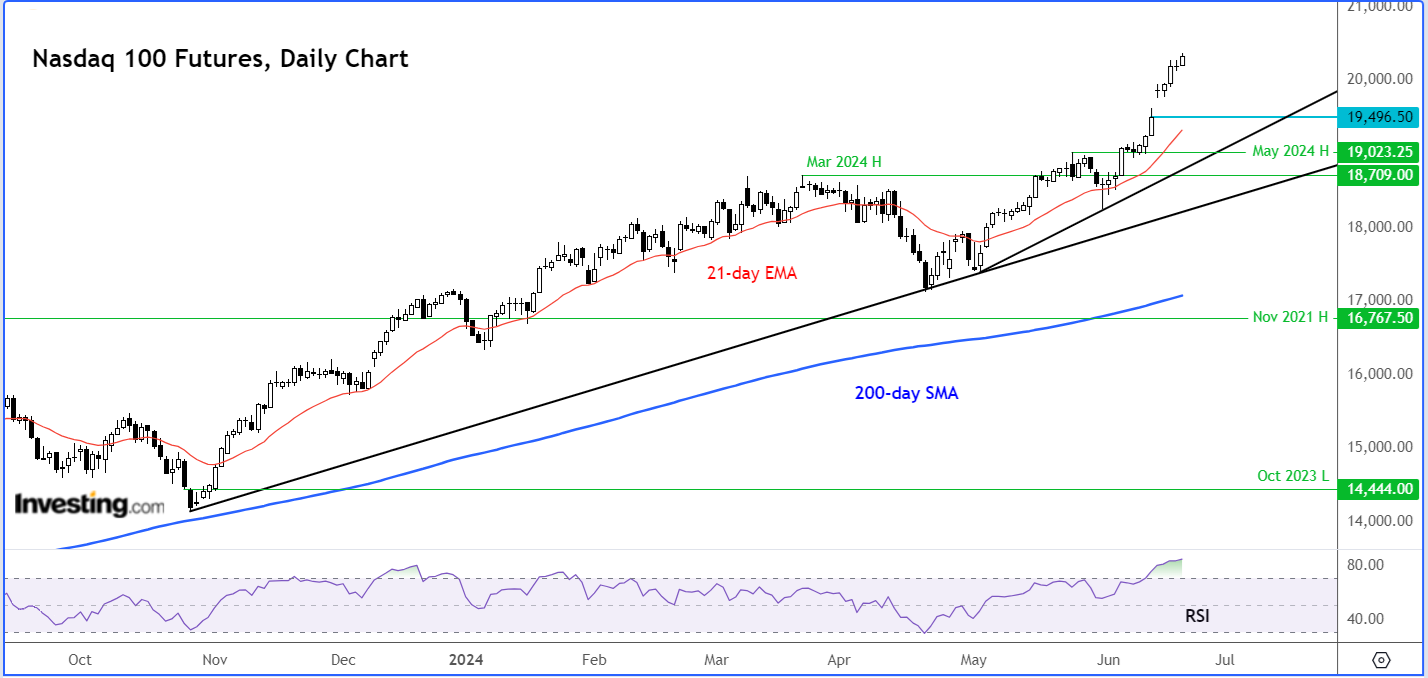
Nasdaq set to break the 20K barrier
Nasdaq 100 futures extended their gains once electronic trading got underway following Wednesday’s holiday in the US. The underlying is seen climbing above 20K when the cash markets open later. This raises a key question: how much further will the rally continue before we see a correction?

One of the ways to trade the Nasdaq 100 can be done through QQQ, an ETF that aims to track the underlying performance of the Nasdaq 100 index. Unsurprisingly, the chart of QQQ looks very similar to the above futures chart, although it only trades during the regular market hours (which is why you can’t see today’s price action yet):
Technical analysis and trade ideas
Since the end of May, QQQ has rallied almost 10% from its lowest point of 443.06 to its most recent high so far of 486.86. It has made more than 17% when you use its lowest point made in April at 413.07. As a result of this sharp rally, the index has reached extreme overbought technically levels.
For example, the relative strength index (RSI) has now climbed well above the 70.0 threshold to reach north of 80.0. With the market being this overbought, it is becoming increasingly uncomfortable for traders to justify continued buying into mini, intraday, dips.
The RSI needs to work off its overbought conditions, at least through time (i.e., consolidation) if not price action (i.e., at least a mini sell-off). For this bullish trend to remain intact, you obviously don’t want to see too much technical damage. But a bit of a pullback should be a welcome sign, even from a bullish point of view, as this will remove some froth from the market.
With QQQ breaking all-time highs that it sets almost on a daily basis, there are no obvious reference points to target on the upside. This is where Fibonacci extensions and measured move objective come into play. QQQ has now reached the 200% extension of the last downswing that took place in March and ended in April. The 261.8% Fibonacci extension of the same swing comes in at 508. Meanwhile, the psychologically-important 500 level also needs to be watched closely, should we get there.
In terms of support levels to watch, the first line of defense for the bulls is at 479.26, which was high from last Friday. Below that, 468.14 is the next level down, where we have seen a breakaway gap. The latter also comes near the 21-day exponential moving average. A more significant support zone is seen at around 449, which corresponds with the high from May.
As mentioned, the bulls would be happy to see a bit of a pullback. However, if we instead see a full-on sell off that potentially takes out the most recent low at 443.06, then that would be a bearish development, for then we will have created our first lower low. In that case, we could then see some follow up technical selling towards the 200 moving average and long-term support at around 412, which was also the high from last year.
However, we will cross that bridge if and when we get there. For now, buying the dip (BTD) at or near short-term supports remains the dominant theme.
What will traders be watching today?
The growing tech optimism coincides with rising confidence among investors that central banks across the developed world will be able to ease monetary policy this year. At last week’s FOMC meeting, Jerome Powell described the US consumer as ‘solid.’
However, Tuesday’s release of weaker data might challenge this view. Sales increased by only 0.1% on the headline front, and the previous month’s data was revised down to -0.2%, while registered -0.1%, with April’s figures also revised lower to -0.1%.
Both measures disappointed forecasts, increasing market expectations for Fed rate cuts this year. Other important data releases this week include , the Philly Fed , and , all due later today, followed by US PMIs and existing home sales on Friday.
If this week’s US data fails to impress, this could see traders price in two or more Federal Reserve rate cuts in 2024 despite the US central bank suggesting there will only be one cut. Last week saw the European Central Bank follow the footsteps of the Bank of Canada and deliver its own 25 basis points cut in interest rates. The Bank of England is likely to follow suit in August. With central banks seen cutting rates, this is one of the reasons fuelling the tech rally, besides the A.I. optimism.
BTD until charts tell you otherwise
But you do have to wonder how much of this hype is already priced in, and some would argue that the markets are over-pricing the optimism and will soon come to know. But for now, buying the dip at or near short-term supports remains the dominant theme. Traders should aim to milk this trend as much as possible. But it is imperative to do so with sound risk management strategies, given a deteriorating macro picture and overstretched valuation concerns.
When the tide eventually turns – and it will – only then would bearish strategies make sense. Trying to pick the top can be very costly, especially when the trend is so strong. The trend has to weaken first before it can reverse. So, there is the added time element to it as well to consider.
***
Be sure to check out InvestingPro to stay in sync with the market trend and what it means for your trading. As with any investment, it’s crucial to research extensively before making any decisions.
InvestingPro empowers investors to make informed decisions by providing a comprehensive analysis of undervalued stocks with the potential for significant upside in the market.
Subscribe here for under $9/month and never miss a bull market again!
Disclaimer: This article is written for informational purposes only; it does not constitute a solicitation, offer, advice, or recommendation to invest as such it is not intended to incentivize the purchase of assets in any way. I would like to remind you that any type of asset, is evaluated from multiple points of view and is highly risky and therefore, any investment decision and the associated risk remains with the investor.
#Nasdaq #Set #Break #20K #Barrier #Heres #Trade