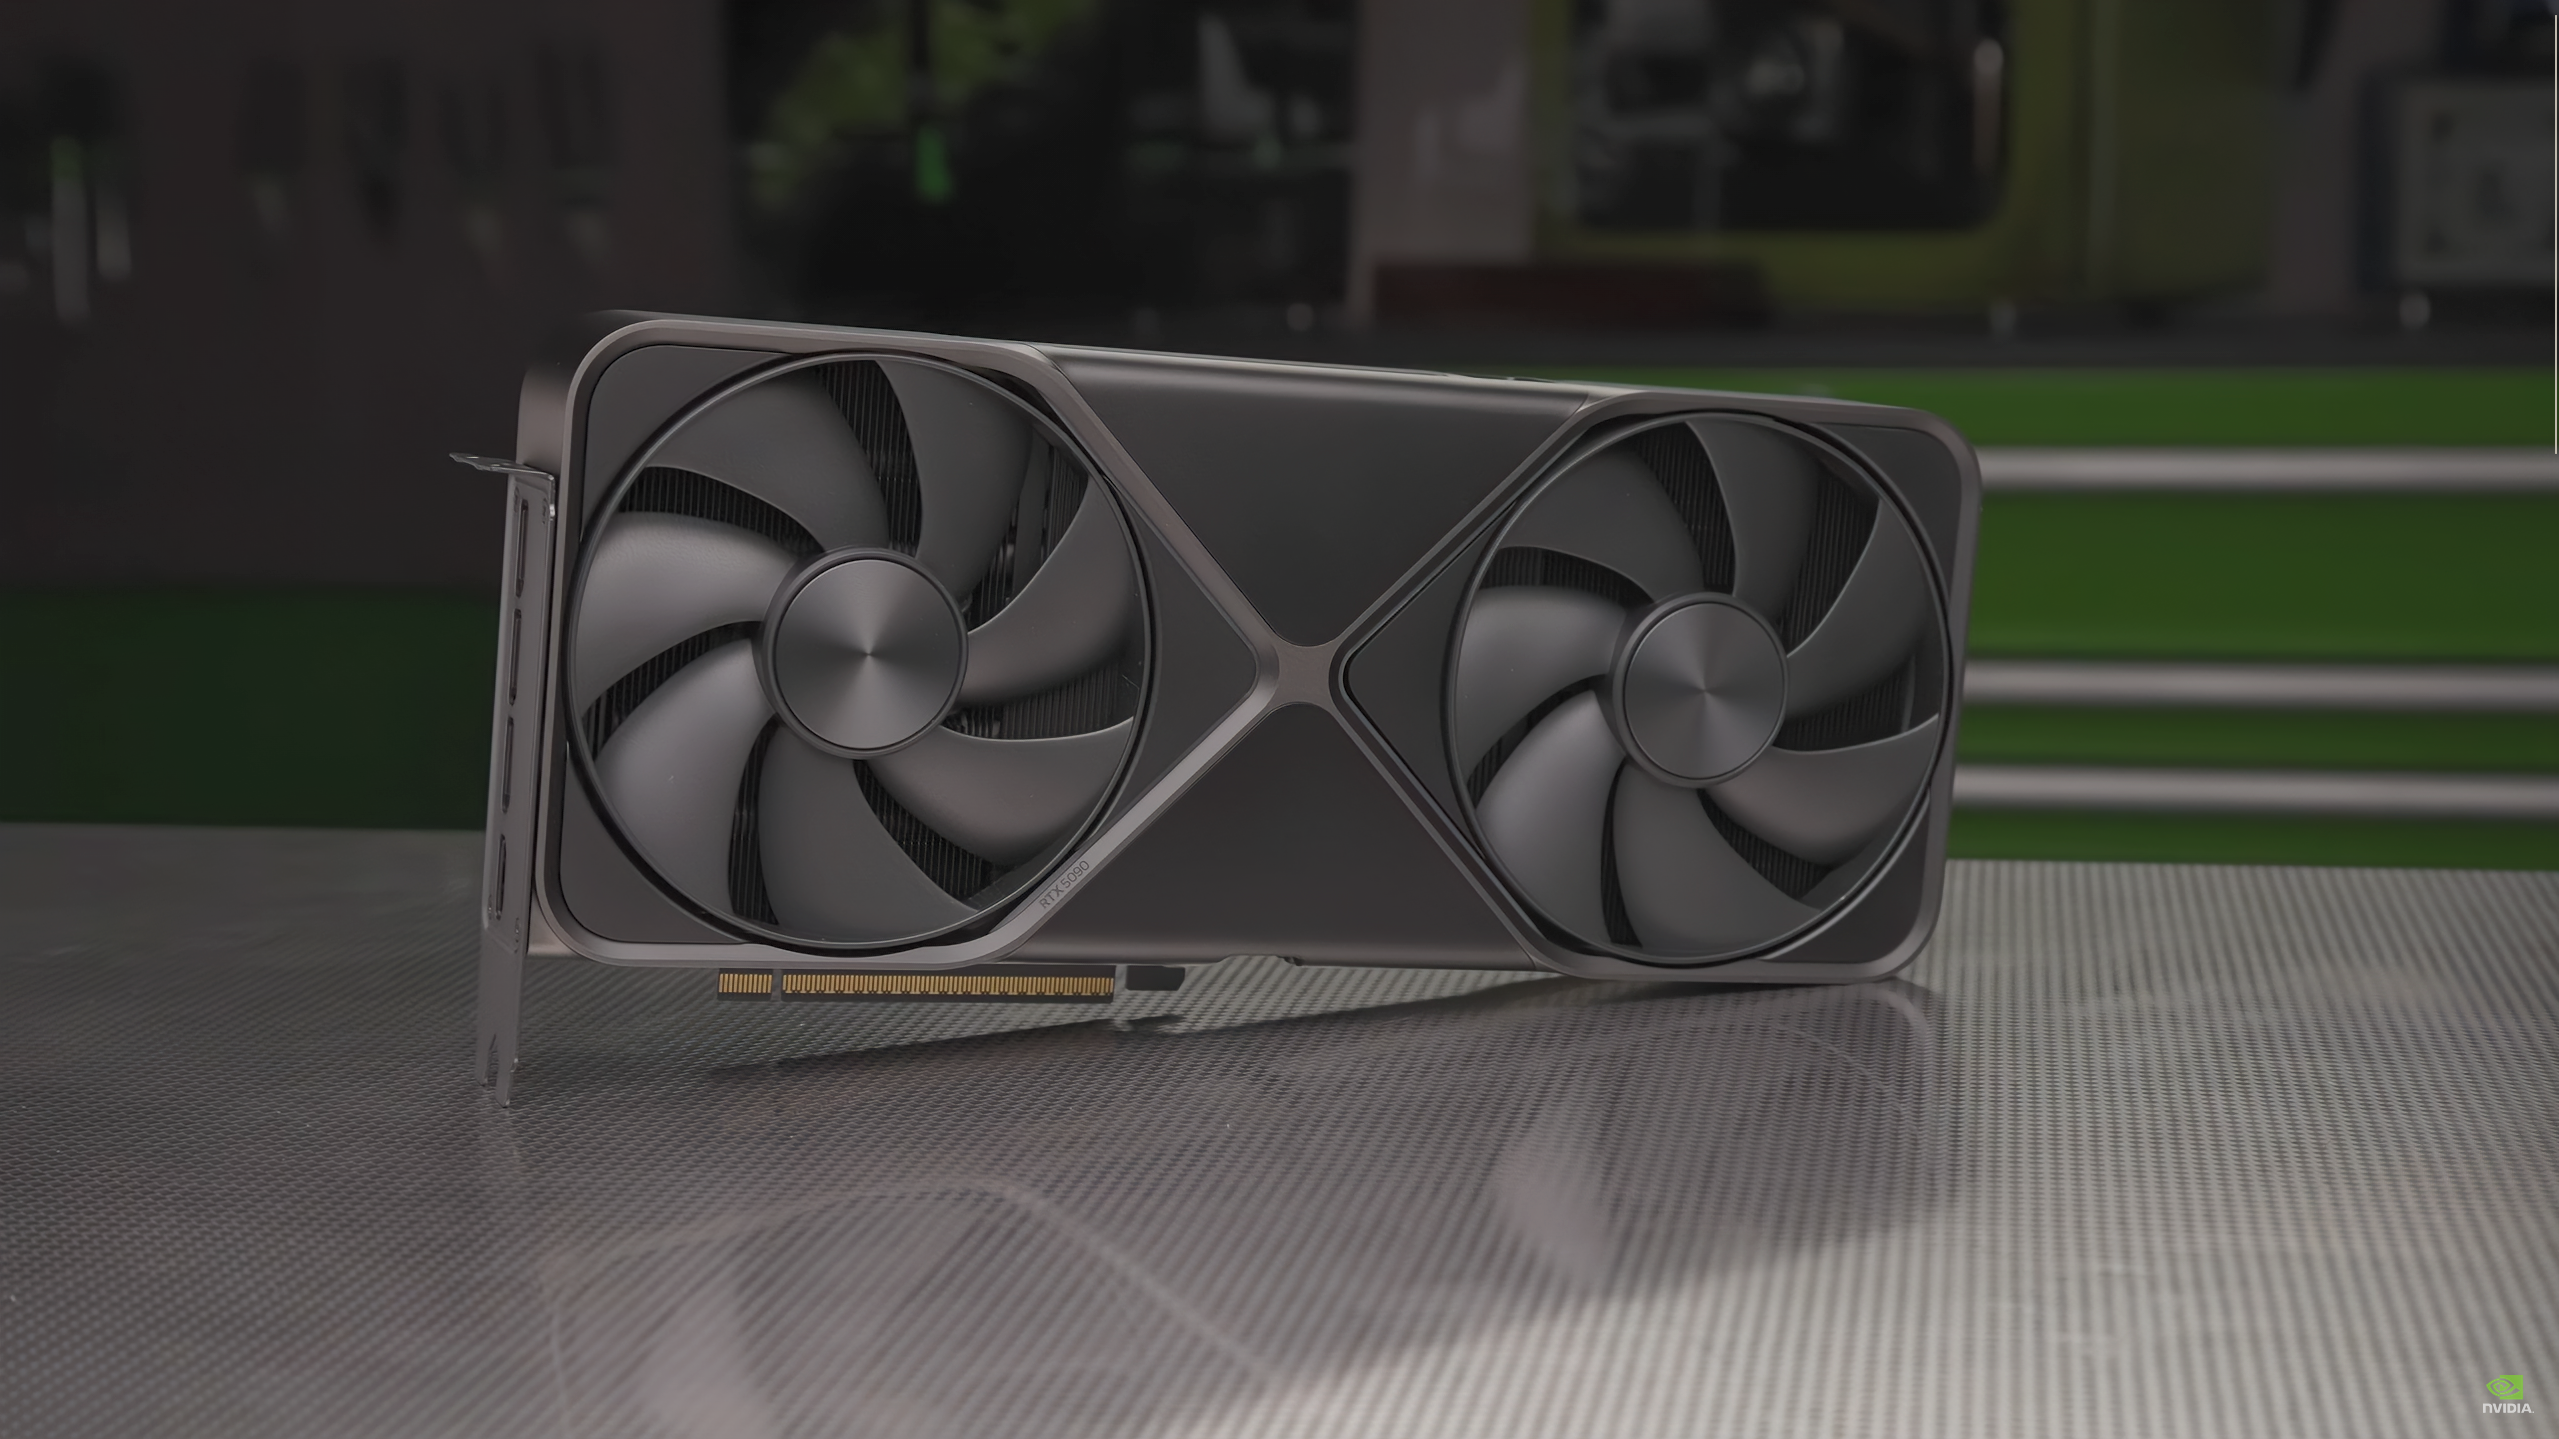
RTX 5090 is allegedly 39% faster than RTX 4090 in 3DMark benchmarks — beats RX 7900 XTX by 93%

The RTX 5090 embargo will be lifted in a couple of days, but Nvidia’s Blackwell flagship GPU benchmark results have already begun to leak. We’ve previously seen Geekbench results for the graphics card, which showed a 27% uplift in performance over the RTX 4090, while Blender tests show the RTX 5090 getting a 36% higher score. Today, VideoCardz shared multiple test results from 3Dmark, reportedly showing the new GPU handily beating the previous top-of-the-line card by up to 53%.
These tests include Speed Way, Steel Nomad, Port Royal, Time Spy, and Fire Strike, with several conducted in 1080p, 1440p, and 2160p/4K resolutions. The publication also said these numbers reportedly came from multiple sources, meaning they are likely verified and reliable. Nonetheless, we recommend taking the results with a grain of salt.
The RTX 5090 offered the most improvement in Steel Nomad (4K), scoring 14,133 points—some 53% higher than the RTX 4090’s 9,216. The previous-generation card did close the gap in other tests, like Time Spy Extreme (2160p), where the RTX 5090’s advantage dropped to 31% but still gained an average advantage of 39% over the RTX 4090.
| Test | GeForce RTX 5090 | GeForce RTX 4090 | % Uplift | GeForce RTX 4080 Super | % Uplift | Radeon RX 7900 XTX | % Uplift |
|---|---|---|---|---|---|---|---|
| Speed Way (1440p) | 14,383 | 10,065 | 43% | 7,442 | 93% | 6,349 | 127% |
| Steel Nomad (4K) | 14,133 | 9,216 | 53% | 6,834 | 107% | 6,595 | 114% |
| Port Royal (1440p) | 36,673 | 26,103 | 40% | 18,288 | 101% | 16,527 | 122% |
| Time Spy (1440p) | 48,732 | 36,328 | 34% | 30,482 | 60% | 28,305 | 72% |
| Time Spy Extreme (2160p) | 25,485 | 19,466 | 31% | 15,288 | 67% | 14,058 | 81% |
| Fire Strike (1080p) | 10,1767 | 72,887 | 40% | 72,275 | 41% | 63,660 | 60% |
| Fire Strike (1440p) | 60,778 | 45257 | 34% | 39,919 | 52% | 34,009 | 79% |
| Fire Strike Ultra (2160p) | 33,114 | 24,828 | 33% | 20,603 | 61% | 17,484 | 89% |
| Average | – | – | 39% | – | 73% | – | 93% |
| Launch Price | $1,999 | $1,599 | 25% | $999 | 100% | $999 | 100% |
However, when we compare the RTX 5090 to AMD’s RX 7900 XTX, the card destroys it in 3DMark benchmarks. The Nvidia GPU scored 127% more points in Speed Way (1440p) and 122% higher in Port Royal (1440p). Even if we average all other results, it still shows a massive 93% advantage, showing the separation between the RTX 5090 and RX 7900 XTX in terms of synthetic performance.
However, note that these scores are based on synthetic tests; real-world gaming numbers will vary depending on the rest of your system, the game title, in-game settings, and several other factors. In addition, the RTX 5090 typically performed better in benchmarks than games, with sources claiming that its advantage falls to 20% when used in actual gameplay.
While a 20% uplift in in-game performance might sound decent, you should also remember that you’re paying 25% more for the RTX 5090. Its launch price of $1,999 puts it on par with the RTX 3090 Ti, which was released at the height of the global chip shortage.
Whatever the case, you should wait for official reviews before making a purchase decision. That way, you can check the results of multiple reviewers to help you ensure you’re getting your money’s worth with this GPU purchase.
#RTX #allegedly #faster #RTX #3DMark #benchmarks #beats #XTX
