
S&P 500: Correlation With USD/CAD Could Signal Index’s Next Move
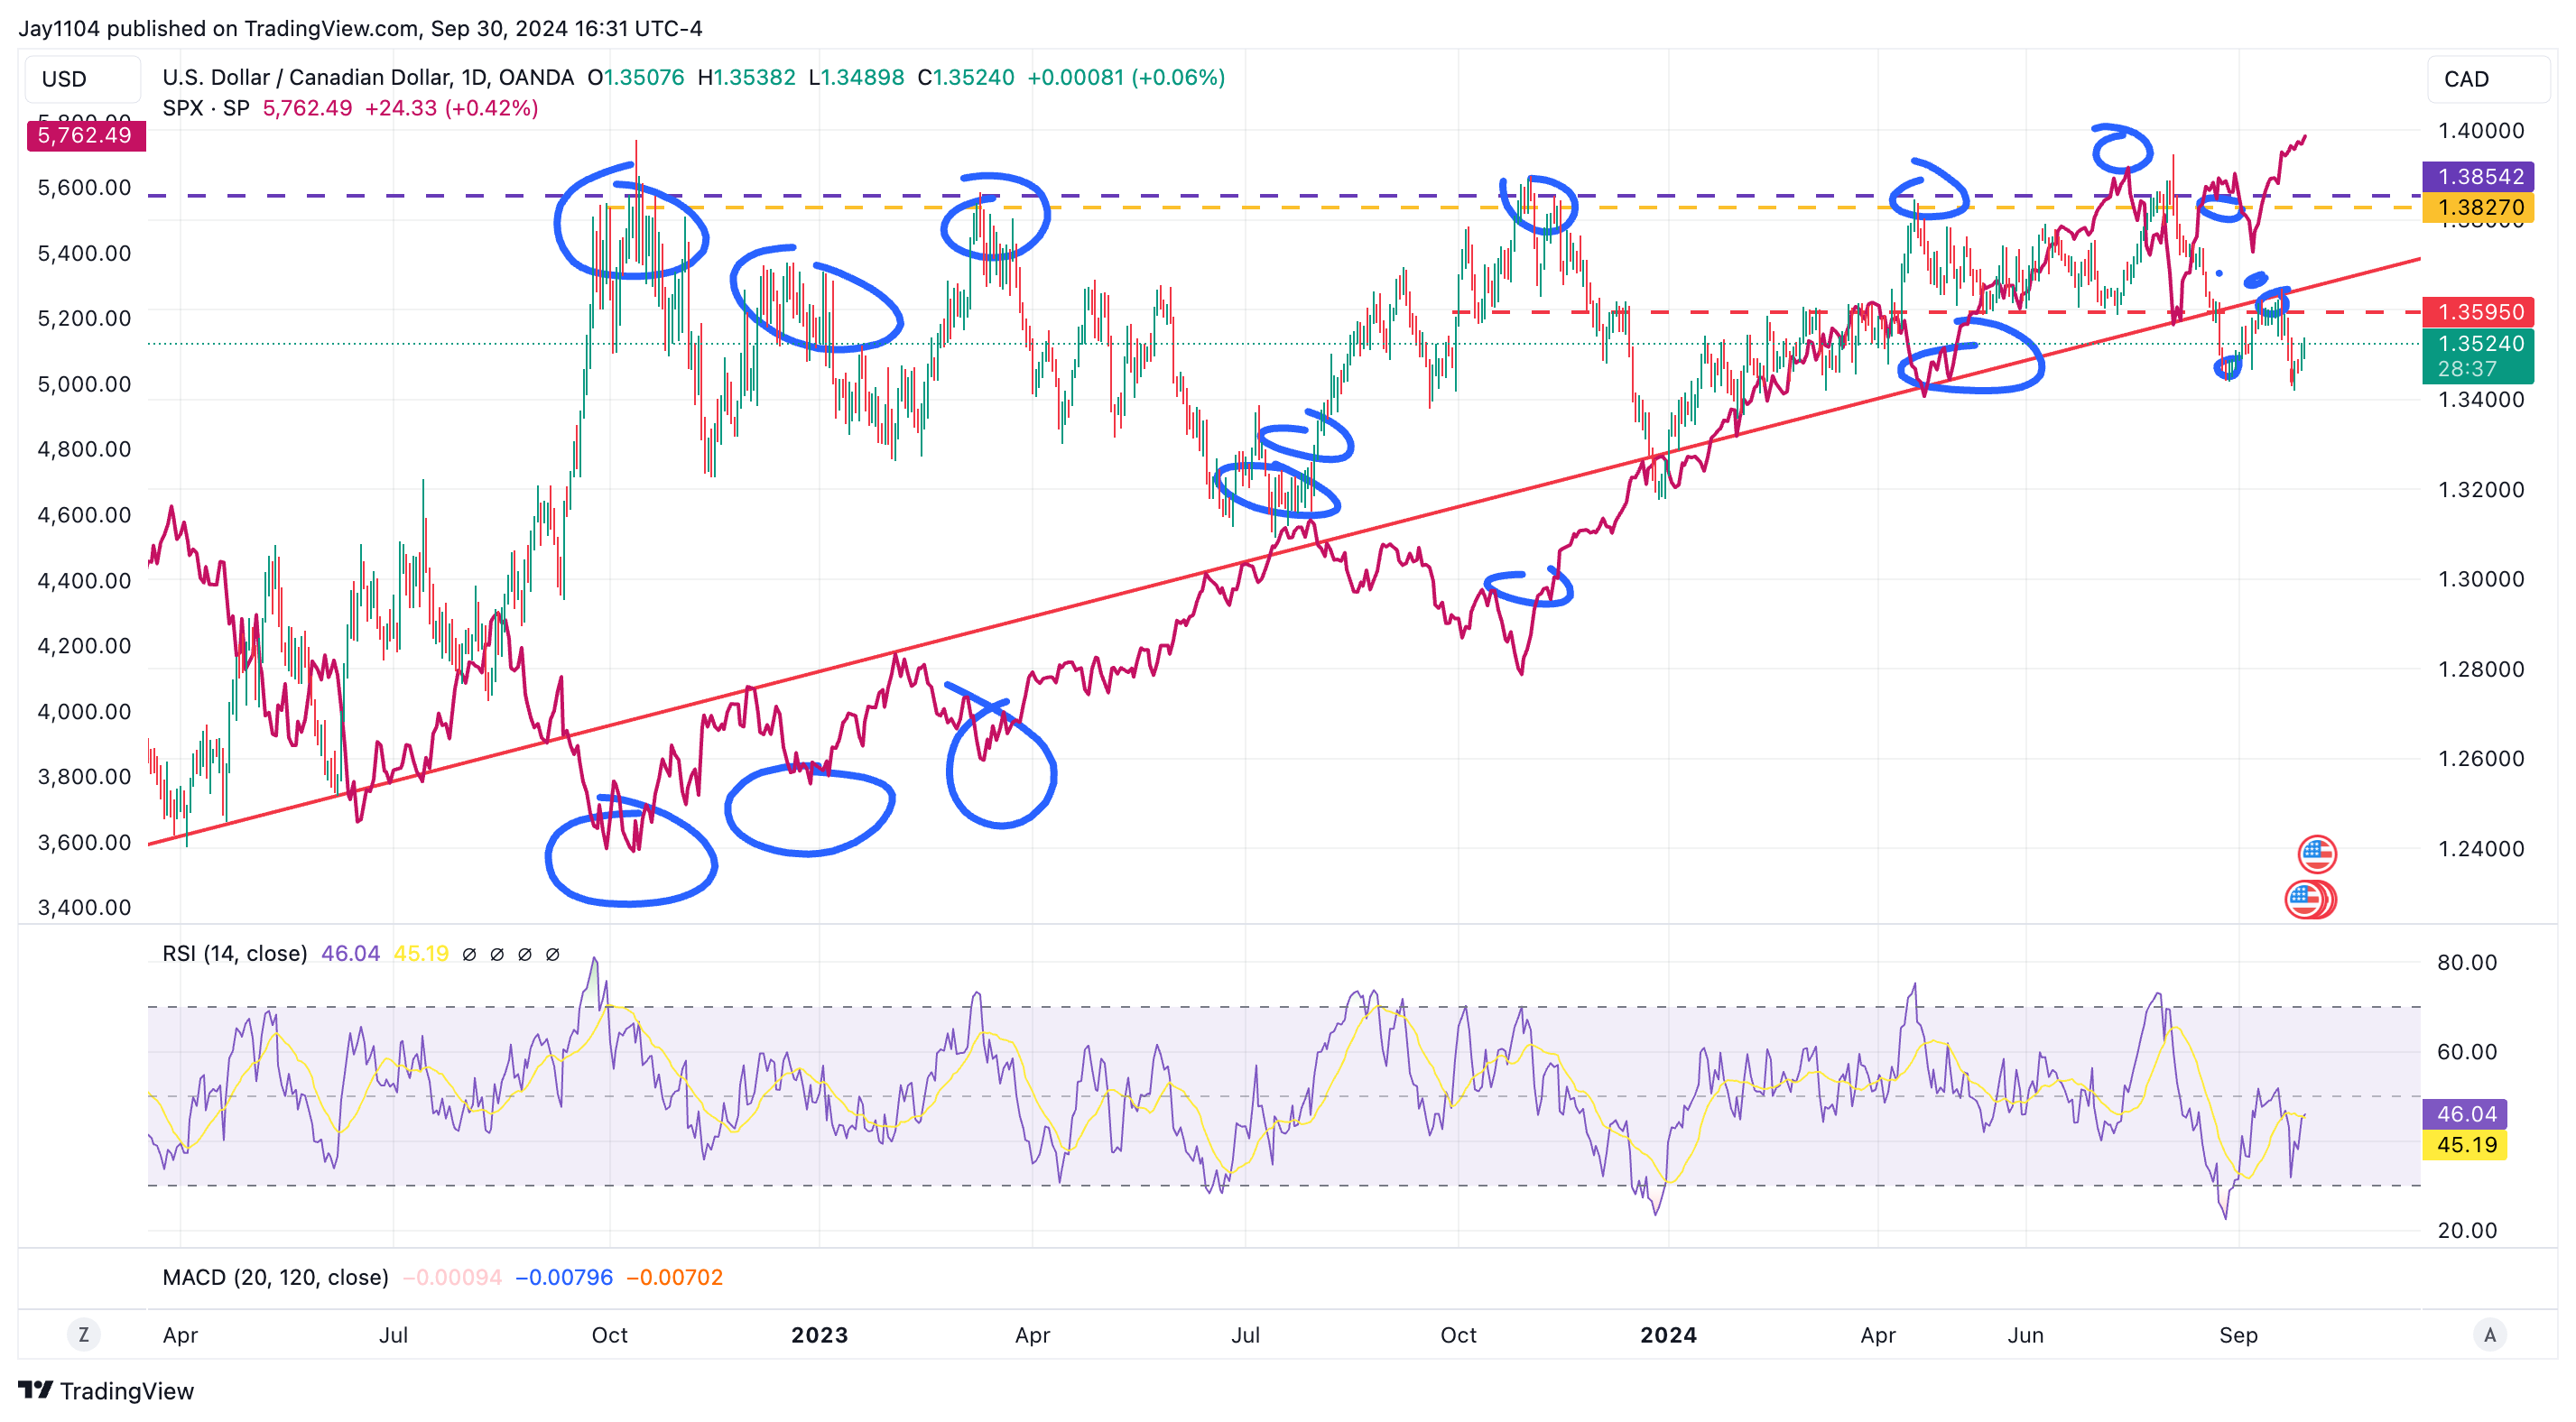
The was weaker yesterday, rising by ten bps to 1.3524. This remains a significant level to watch because if the USD/CAD has indeed bottomed, it suggests the may have topped, as this pattern has been playing out for quite some time now.

We might still see that gap at 5,620 filled in the SPX. Unfortunately, the JPM collar has just delayed the move. If it does fill, this seems like a good week for it to happen, given the volatility likely to occur ahead of and after some of these big data points.
JPM Collar Comes Off – Volatility Ahead?
Yesterday’s session was a calm day until 2 PM when the JPM collar with a 5,750 strike price was closed out, and the December contracts were initiated.
As anticipated, this triggered significant volatility in the market, and now that last week’s pinning effect is gone, the turbulence is likely to persist.
This led to a sharp and volatile move in the during the final 90 minutes of trading, with the index initially dropping and then rebounding sharply.
For the rest of the week, yesterday’s trading action has little impact on what follows. The stability we’ve seen over the past week has faded, and natural flows will drive the market again.
Meanwhile, the market reacted slightly more hawkishly to Jay Powell’s Q&A session, with expectations for the November overnight rate rising to 4.52%, up from the previous view of 4.5%.
While it’s a minor shift, it’s worth noting how the market has interpreted the news.
Finally, the implied volatility (IV) dispersion trade around earnings seems to have primarily been set in motion. Last year, IV peaked during the first few days of October, and we are essentially at that same point now.
Historically, we also tend to see IV for 1-month options at 100% moneyness increase as we approach one month ahead of earnings season.
With the one-month implied correlation index already hovering around 11, there doesn’t seem to be much room left for it to decline further. By July 1, the index had already dropped to about 5, and it doesn’t appear to be on track for that kind of move again.
If that’s the case, buying the “Magnificent 7” stocks may not significantly lift the indexes heading into earnings season.
If implied volatility rises this week, especially with the jobs report on Friday, we could also see the implied correlation index rise. This scenario would align with the USD/CAD potentially finding a bottom.
#Correlation #USDCAD #Signal #Indexs #Move