
S&P 500 Emini Reversal Below 5,400 Likely
S&P Emini pre-open market analysis
- The is beginning to go sideways after breaking above the 5,400 big round number. However, the market is beginning to stall out. This is a warning that the rally up to the 5,400 is likely a bull leg in what will become a trading range.
- The bears do not mind the rally up to 5,400 as long as the market stalls near the round number and eventually reverses back down.
- The bears want to get a selloff down to the May 31st low, which is the bottom of the most recent higher low.
- The Bulls want to prevent the market from falling below the May 31st higher low. As long as the daily chart is making higher lows, the bulls can argue that the market is in a bull trend.
- The daily chart will probably begin to pull back over the next several weeks. The bears need to create more selling pressure to convince traders that the rally from the May 31st low is an exhaustive buy climax.
- Traders will pay attention over the next several days to see what kind of selling pressure the bears can create.
What to Expect Today
- Emini is down 24 points in the overnight Globex session.
- The Globex market sold off during the overnight session and recently found buyers around 5,400 round number.
- Traders should expect the open to have a lot of trading range price action. There is an 80% chance of a trading range open and only a 20% chance of a trend from the open up or down.
- This means the odds favor a double top/bottom or a wedge top/bottom forming on the open.
- Most traders should consider not trading during the first 6-12 bars unless they can make quick decisions since most breakouts fail on the open.
- Ideally, traders should focus on catching the opening swing that typically begins before the end of the second hour.
- Today is Friday, which means the weekly chart is important. The Bulls want to close the weekly chart above 5,400, ideally, above the week’s midpoint (5394,25). The bears want the opposite.
- Traders should be prepared for a potential surprise breakout late in the day as traders decide on the close of the weekly chart.
- Traders should pay attention to the 5,400 round number as it will probably remain a magnet for most of the day.
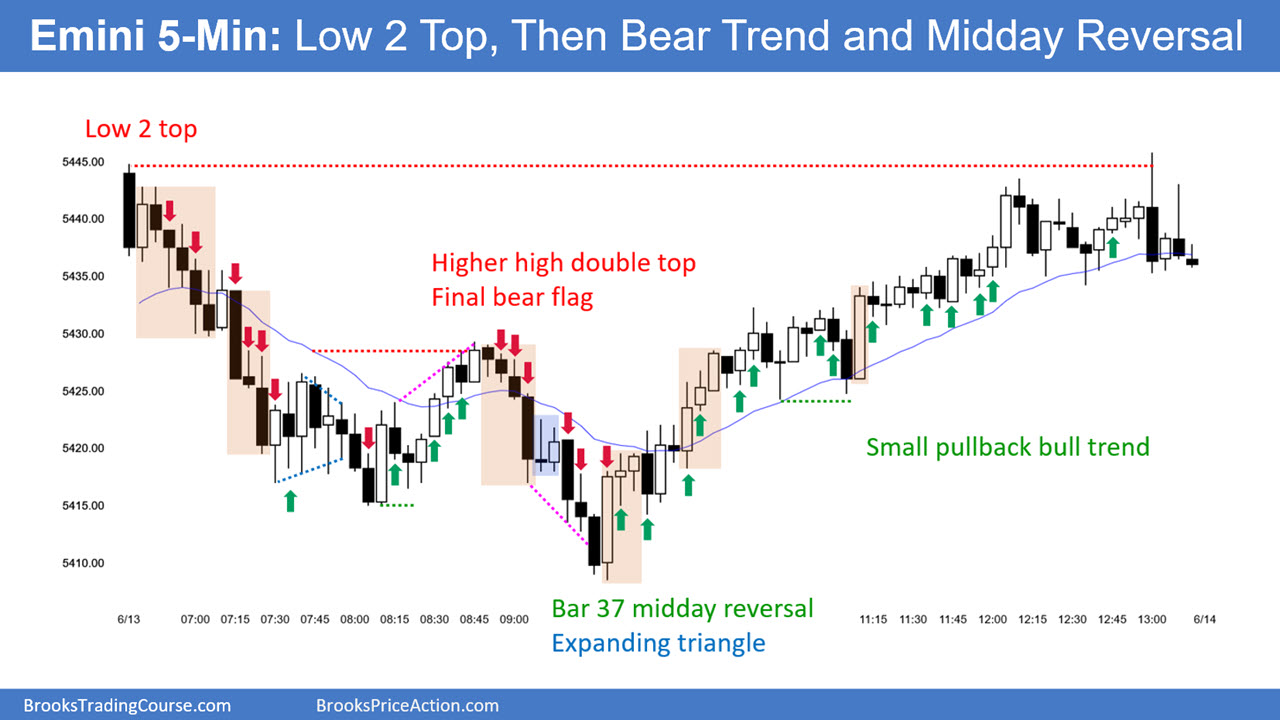
Yesterday’s Emini Setups

Here are reasonable stop-entry setups from yesterday. I show each buy entry bar with a green arrow and each sell entry bar with a red arrow. Buyers of both the Brooks Trading Course and Encyclopedia of Chart Patterns have access to a near 4-year library of more detailed explanations of swing trade setups (see Online Course/BTC Daily Setups). Encyclopedia members get current daily charts added to Encyclopedia.
My goal with these charts is to present an Always In perspective. If a trader was trying to be Always In or nearly Always In a position all day, and he was not currently in the market, these entries would be logical times for him to enter. These therefore are swing entries.
It is important to understand that most swing setups do not lead to swing trades. As soon as traders are disappointed, many exit. Those who exit prefer to get out with a small profit (scalp), but often have to exit with a small loss.
If the risk is too big for your account, you should wait for trades with less risk or trade an alternative market like the Micro Emini.
#Emini #Reversal