
S&P 500: Is the Market Entering a Correction?
Stock prices moved mostly sideways on Friday, with the closing 0.13% lower, slightly pulling back from Thursday’s new record high of 5,767.37. Futures contracts indicate the index is likely to open 0.3% lower this morning.
Investor sentiment remains elevated, as shown by last Wednesday’s AAII Investor Sentiment Survey, which reported that 49.6% of individual investors are bullish, while only 23.7% of them are bearish, down from 26.4% last week.
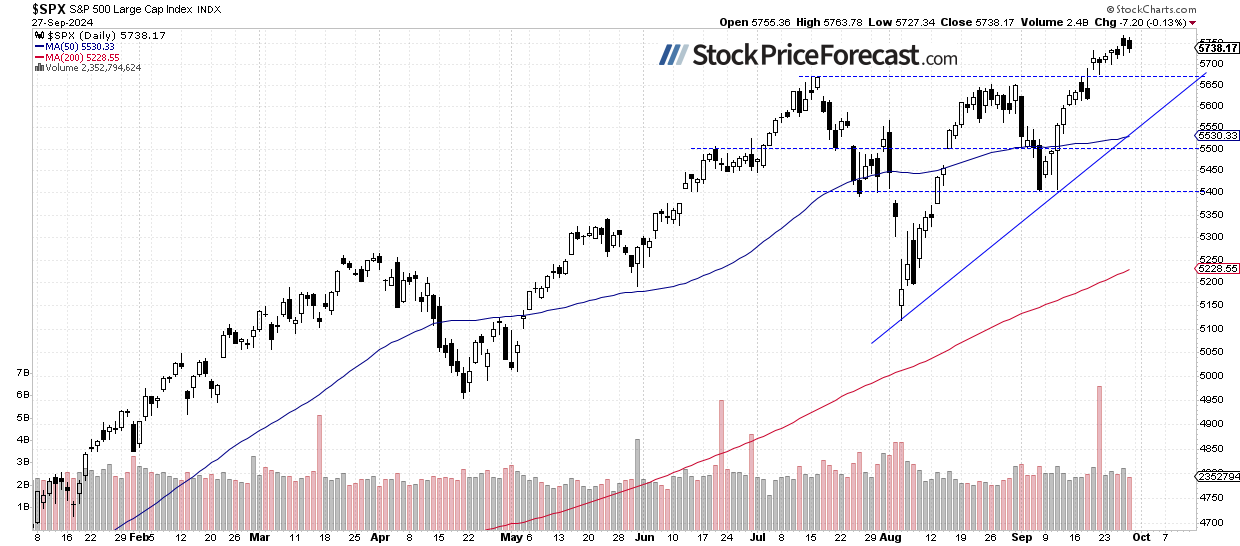
The S&P 500 continues to trade above the 5,700 level, as we can see on the daily chart.
S&P 500: Another Weekly Gain
Compared to the previous Friday’s close, the S&P 500 gained 0.62%, extending the prior week’s advance of 1.4%.
The market has continued to rally and hit new records after breaking out the previous week. Key support remains around the previous highs at the 5,650 level.
Nasdaq 100: Consolidating Around 20,000
The pulled back by 0.53% on Friday, reaching the 20,000 level again. Although it broke above this level last Thursday, it failed to move significantly higher. Resistance remains around 20,250. This morning, the index is likely to open 0.4% lower, as indicated by futures.
VIX Rebounded From 15
On September 6, the , a measure of market fear, reached a local high of 23.76. It was indicating elevated fear among investors. However, a stock rebound followed by a record-breaking rally pushed the VIX lower. On Thursday, it fell to 14.90, its lowest level since late August. However, on Friday, the VIX rebounded to around 17 as stocks pulled back.
Historically, a dropping VIX indicates less fear in the market, and rising VIX accompanies stock market downturns. However, the lower the VIX, the higher the probability of the market’s downward reversal. Conversely, the higher the VIX, the higher the probability of the market’s upward reversal.
S&P 500 Futures Contract Dipping Below 5,800
Let’s take a look at the hourly chart of the contract. On Thursday, it broke above the 5,800 level, extending its short-term uptrend to new record highs. However, it moved sideways after that. This morning, futures are trading near recent lows after breaking back below 5,800. Potential support levels are around 5,780, with the next at 5,730–5,750.
Conclusion
Last week, the market hit new record highs for the S&P 500, but sentiment weakened slightly on Friday, and this morning the index is expected to open lower. The question remains: Will the uptrend continue despite overbought conditions? While no clear negative signals have appeared, the rally seems overstretched.
about the coming FOMC release “A “buy the rumor, sell the news” scenario seems likely, but a bullish breakout to new highs can’t be ruled out either.” The previous Thursday’s rally invalidated a quick reversal scenario, but the market could still be forming a top before a more significant correction.
I opened a speculative short position in the S&P 500 futures contract on September 16.
In my Stock Price Forecast for September 2024, I noted that, “the market experienced significant volatility in August, with a roller-coaster ride that included a sell-off to the August 5 local low and a subsequent advance, leading to a consolidation near the record high. (…) sharp reversal suggests more volatility in September. In August, I wrote that ‘August is beginning on a very bearish note, but the market may find a local bottom at some point.’ The same could be said today, and September will likely not be entirely bearish for stocks.”
For now, my short-term outlook remains bearish.
Here’s the breakdown:
- The S&P 500 pulled back slightly from its record high.
- The market may still be forming a topping pattern before a downward correction
In my opinion, the short-term outlook is bearish.
#Market #Entering #Correction