
When Should Investors Look at the Monthly Charts?
I have used monthly charts to determine support and resistance levels.
Moreover, this timeframe is often the best indicator for either the end of a countermove or the start of a bigger megatrend.
The 23-month moving average (blue) and the 80-month moving average (green) are my go-to’s.
One is a shorter 2-year business cycle while the other is about a 6–7-year business cycle.
Here are a bunch of monthly charts that have my attention.
Often, a picture says 1000 words.
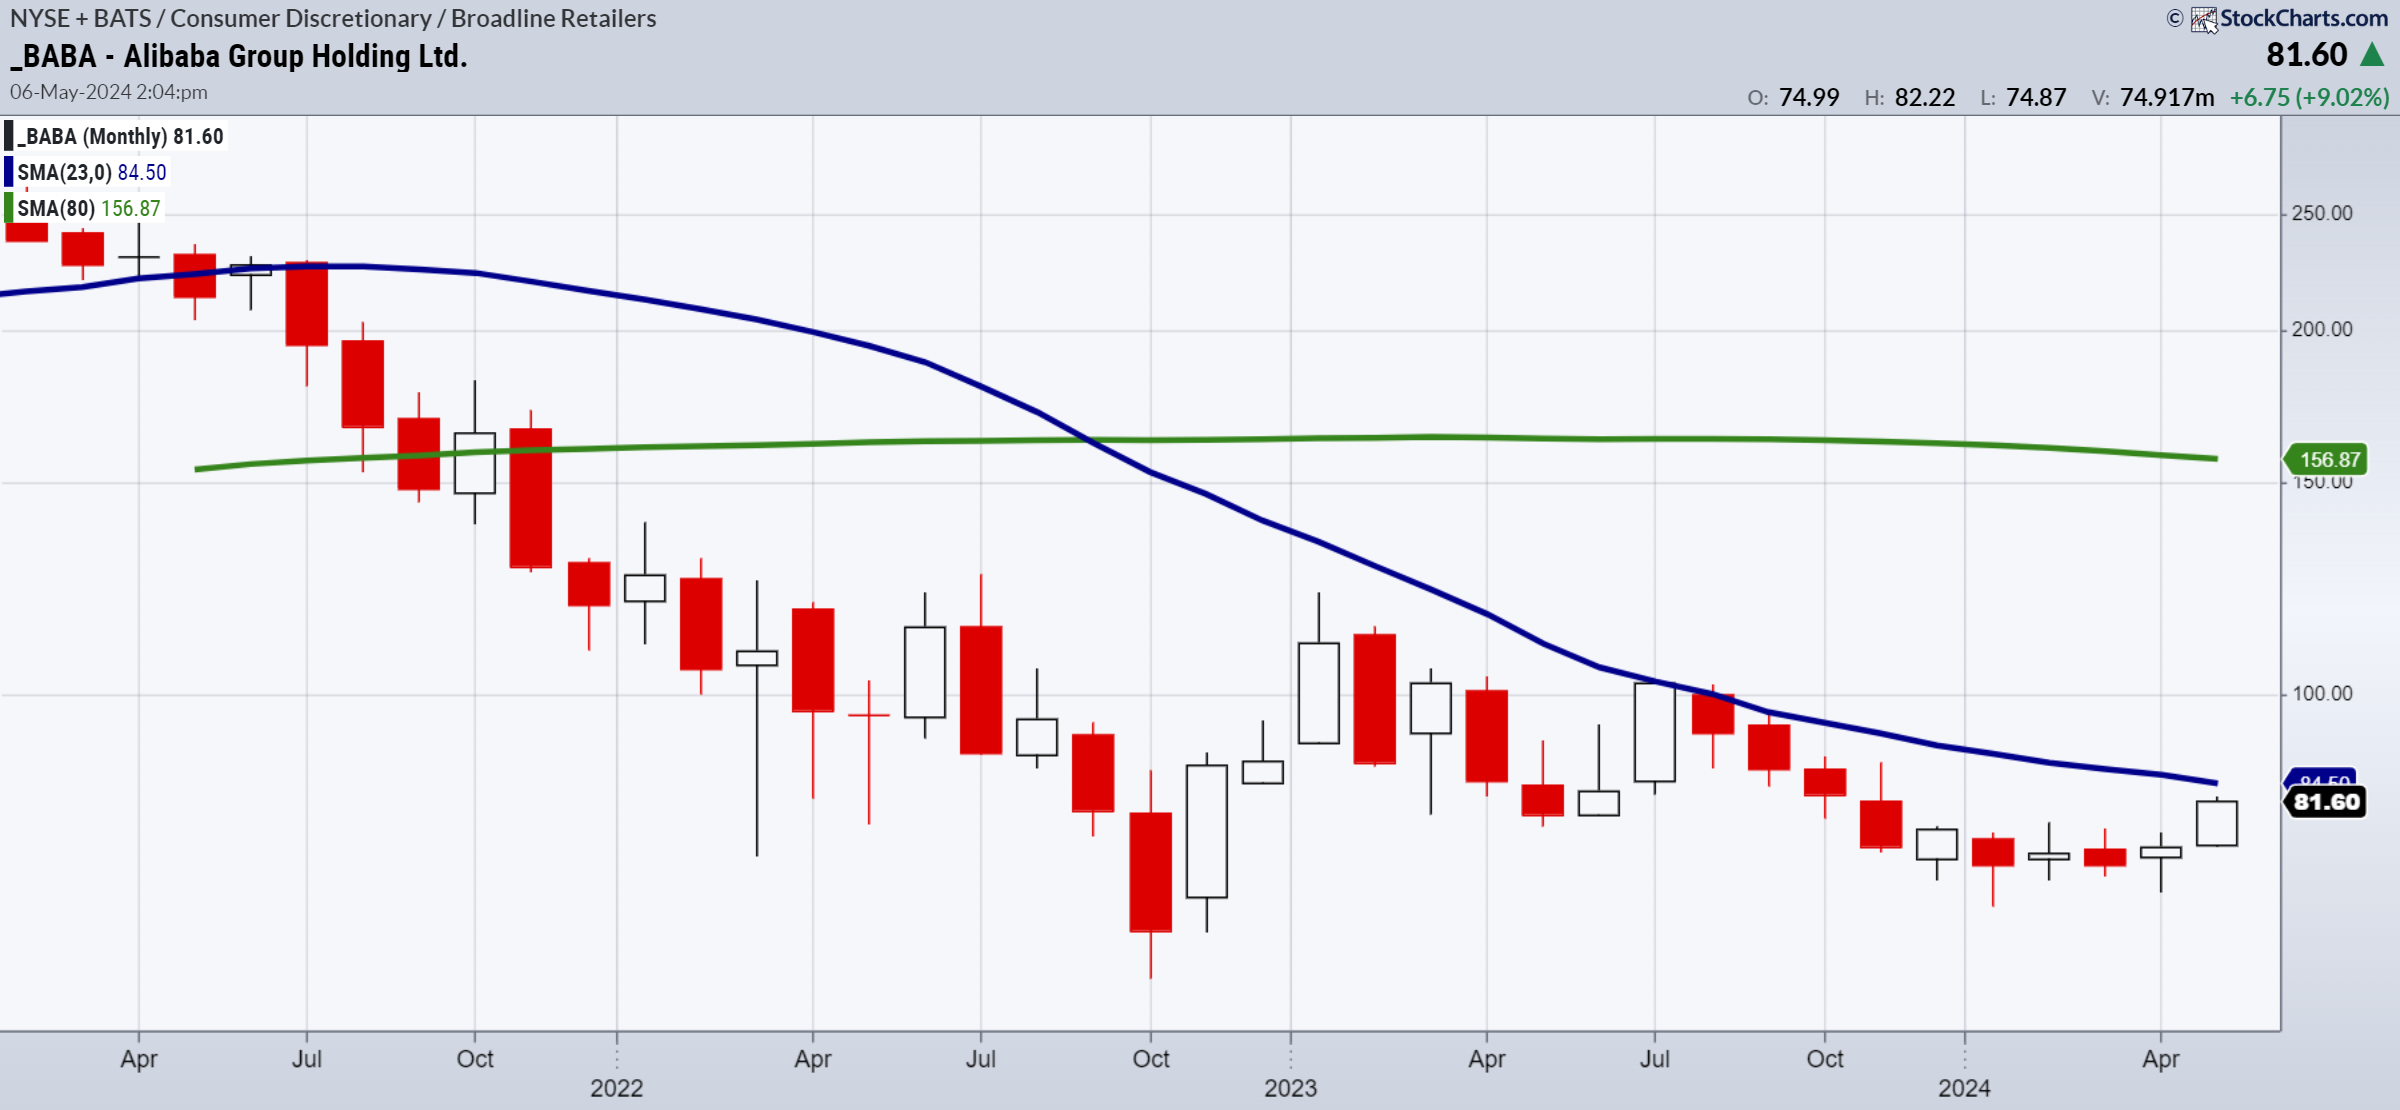
Alibaba (NYSE:)-the end of the correction or the start of a much bigger move? BABA has traded below the 23-month moving average since 2021.
sure gets bullish-but the road back to the monthly MAs is long and perilous for now.
, Sure we will see corrections. But the trend is quite clear and will not give us any pause until it breaks under 160.
The ETF for ). It gave us a great signal in 202. Now, with May sitting around the 23-month MA, is the move over?
How clear is this? Tesla (NASDAQ:) is below the 23-month MA but above the 200-month MA.
What about Granny Retail ?
Above the 23-month so in expansion. But also having an inside month to May.
Best we can say from the chart-Granny looks constructive and we err to bullish. But there is more to prove.
ETF Summary
- S&P 500 (SPY) Gap over the 50-DMA to an unconfirmed return to bullish phase
- Russell 2000 (IWM) Gap over the 50-DMA to an unconfirmed return to bullish phase
- Dow (DIA) Gap over the 50-DMA to an unconfirmed return to bullish phase
- Nasdaq (QQQ) Gap over the 50-DMA to an unconfirmed return to bullish phase
- Regional banks (KRE) Through 50.50 compelling
- Semiconductors (SMH) Gap over the 50-DMA to an unconfirmed return to bullish phase
- Transportation (IYT) 63 support 67 resistance -still relatively weak
- Biotechnology (IBB) 128-135 new range to watch
- Retail (XRT) 71.50 support 75 resistance
- iShares iBoxx Hi Yd Cor Bond ETF (HYG) 77.00 now must hold (50DMA)
#Investors #Monthly #Charts